A Third of Russell 1000 Workers Don’t Earn a Living Wage
It’s not just Restaurants and Retail. Many Pharma and Biotech giants are also lagging on fair pay!


For the second year now, Revelio Labs' workforce and salary data are powering JUST Capital’s Most Just Company Rankings, including the share of workers at each company earning a living wage.
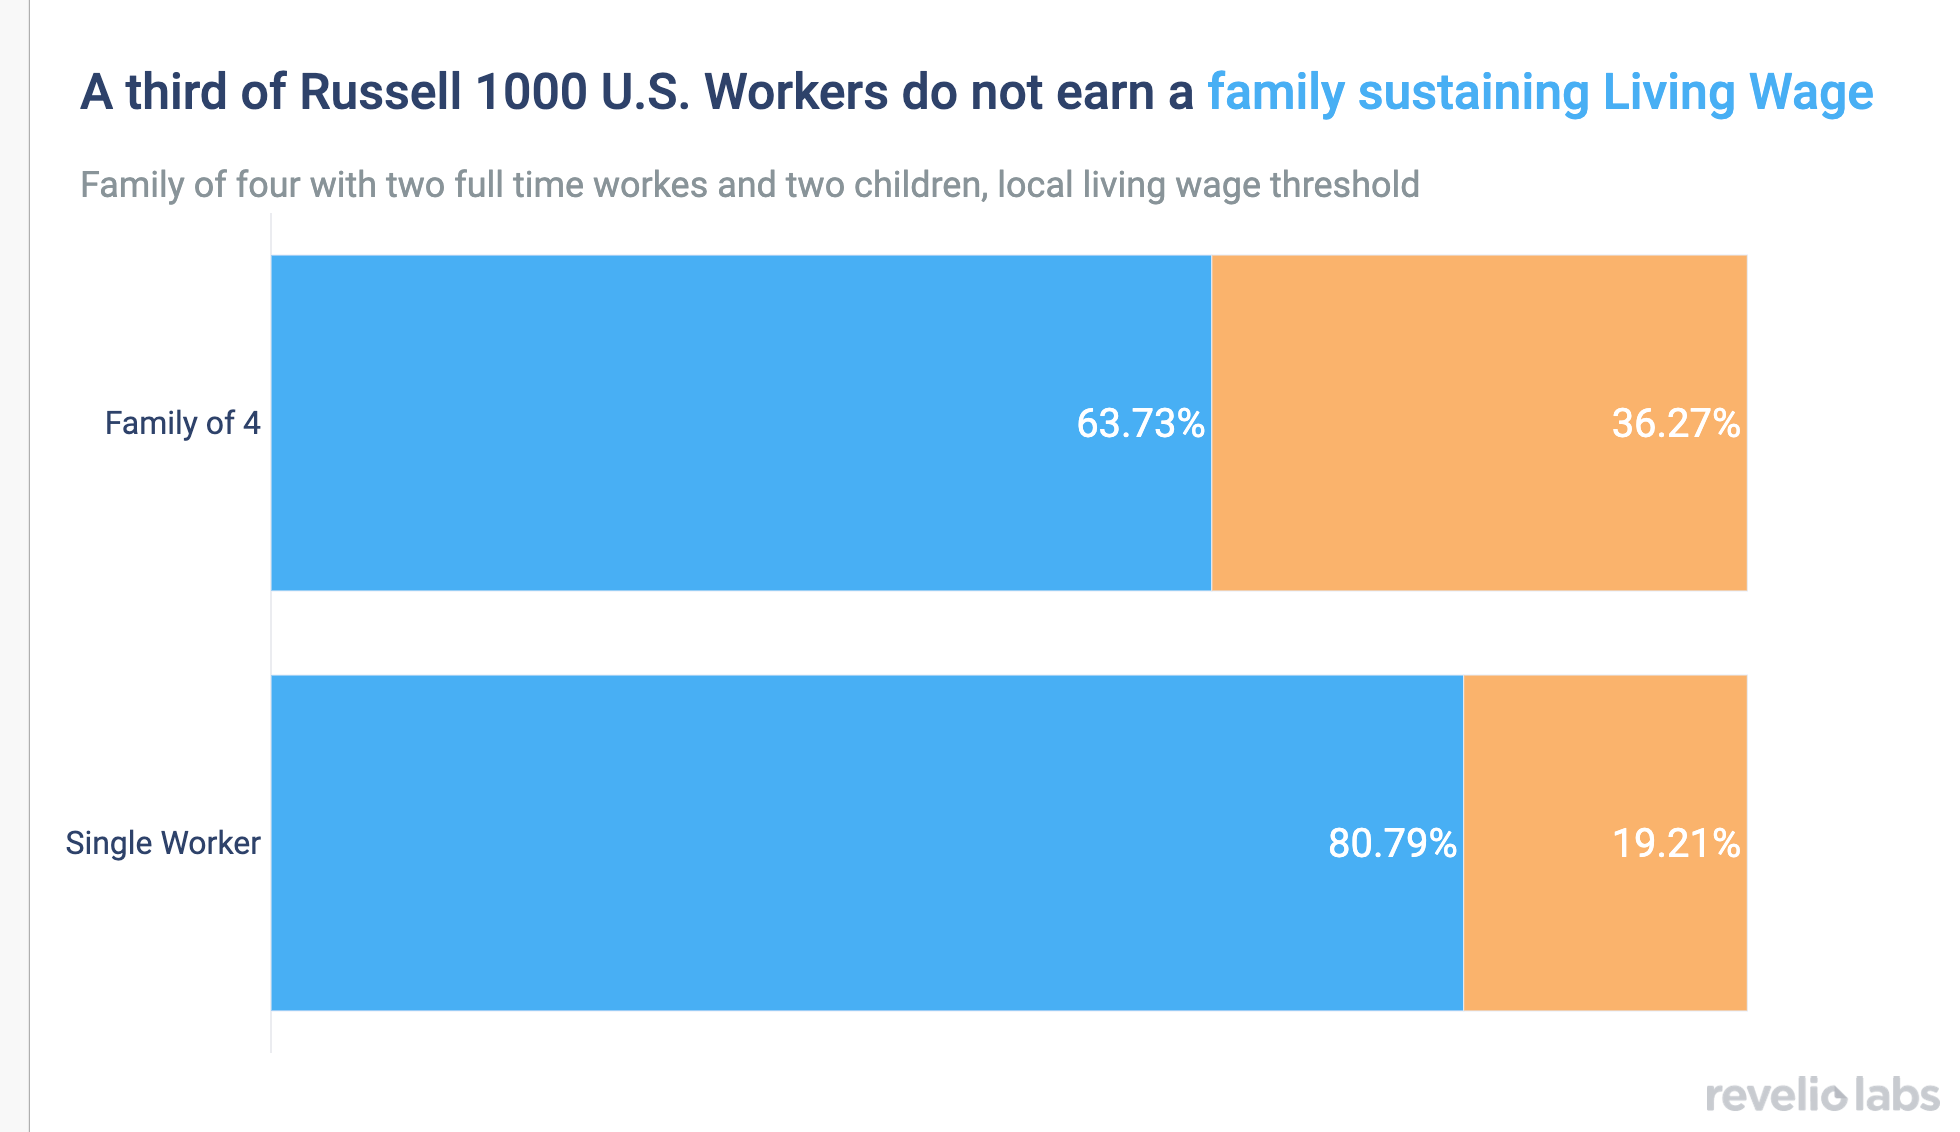
Our estimates show that 36.3% of workers at Russell 1000 companies are not making a family-sustaining living wage, and 20% do not earn enough to support themselves.
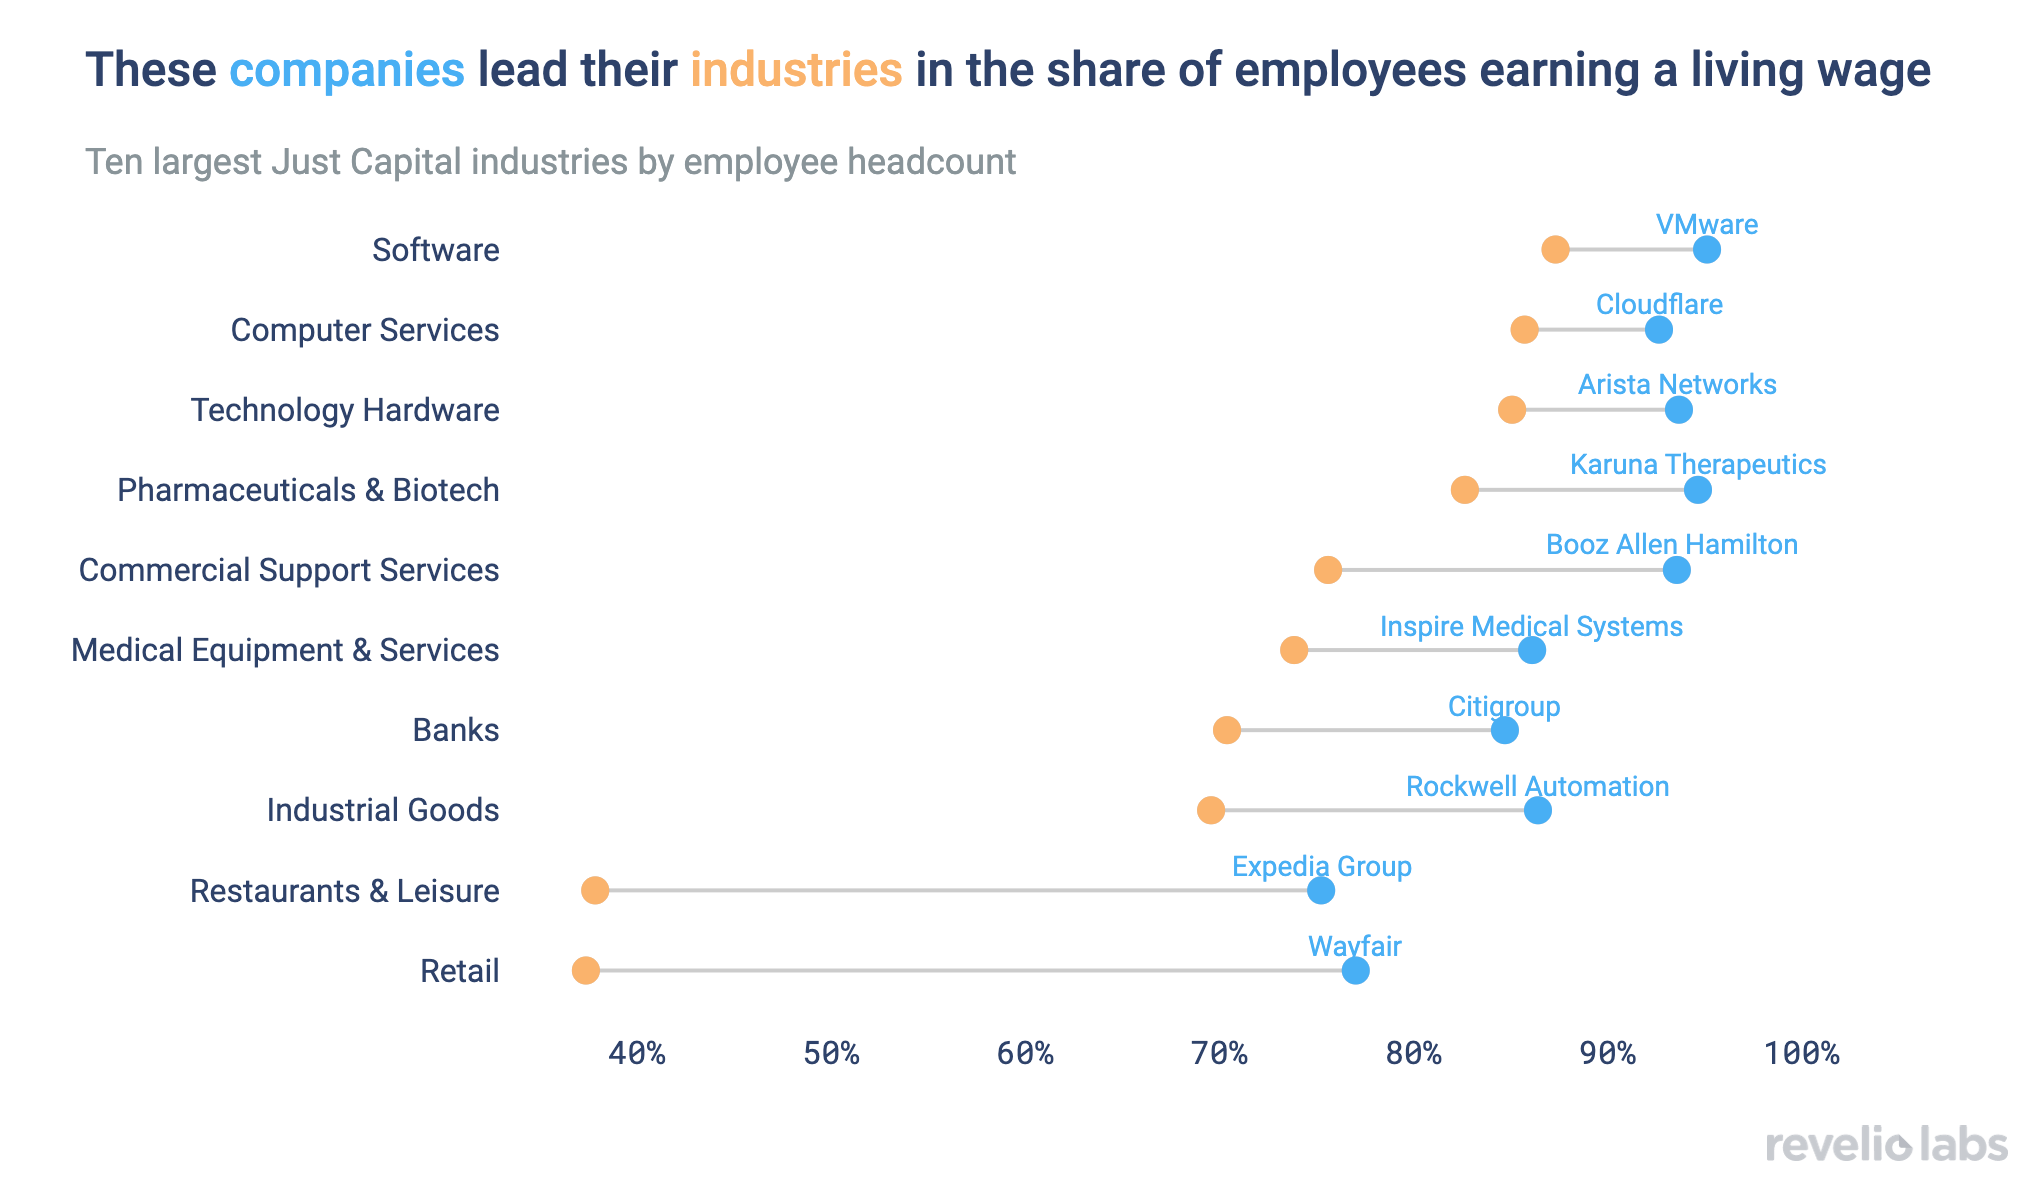
While companies in industries with high shares of low-wage workers like Retail or Restaurants naturally have lower shares of employees earning a living wage, there is still considerable variation within industries. Standout companies like Wayfair in Retail and Rockwell Automation in Industrial Goods are leading their industries in share of workers earning a living wage.
What’s the most important thing a business should do? JUST Capital’s 2023 Issues Survey – The People’s Priorities, measuring the most important business issues, found that paying a fair, living wage was the highest priority for a fourth consecutive year. For the second year now, Revelio Labs is partnering with JUST Capital to power the Most Just Company Rankings, providing insights into wage distributions at Russell 1000 companies.
Using our universal HR database, coupled with our salary and compensation data, Revelio Labs powers three inputs into the JUST Capital Rankings: (1) the median U.S. worker pay (to compare to CEO compensation), (2) the share of U.S. workers earning a living wage to support a family of two full-time workers and two children, and (3) a score that evaluates how fairly a company pays for similar occupations compared to its industry peers.
This year’s results show that among all U.S.-based Russell 1000 workers, 36% of workers are not making a family-sustaining living wage, a national average of USD 25.02 per hour for a two-working-adult, two-children household in 2023, according to the MIT Living Wage Calculator. That amounts to about 6.1 million workers who are not earning enough, despite working full-time, to support a family. We further estimate that about 19.2% of Russell 1000 workers do not earn enough to meet their own basic needs – or a living wage for one full-time employee without dependents.

Workers in the Russell 1000 make up around 10% of the US workforce. These companies are the best-performing public companies by market capitalization and, as such, their workers still make more than the average US worker. The median worker in the US earned USD 58,084 annually according to the BLS, while the median Russell 1000 worker earned USD 73,305. Russell 1000 workers also enjoyed higher wage gains in 2023 compared to average workers, which allowed them to slightly better weather increases in costs of living during 2023.
Industries naturally vary by their share of workers earning a living wage, depending on their composition of high-wage and lower-wage earners. Software and Biotech tend to have very high living wage scores for example, as they typically employ many high wage earners and fewer workers that work in production or retail that tend to be lower paid. Nevertheless, even within industries, there is large variation by company in the shares of workers making living wages. The plot below shows the industry average and their respective industry leaders as shining examples for a select group of industries. In the Industrial Goods industry, the difference is particularly striking – on average only 70% of workers in the industry earn a living wage, but Rockwell Automation pays almost 90% of their workers a living wage. Wayfair and Expedia also far outperform their industry peers. This is because their workforce composition looks more like Tech companies than Retail and Restaurant and Leisure companies, respectively.
On the other end of the spectrum are companies that perform much worse than their industry peers in terms of the share of workers earning a living wage. We won’t name names here, but there are some real laggards in the Pharmaceutical as well as Medical Equipment & Service industry.
Sign up for our newsletter
Our weekly data driven newsletter provides in-depth analysis of workforce trends and news, delivered straight to your inbox!
Last year, we compared all Russell 1000 worker salaries to one population-weighted national living wage threshold, no matter where a worker lives and works. Our Revelio Labs salary prediction model takes many things about a worker into account, including their company, role, experience, and location. This creates some unfair comparisons both ways: Workers in high-cost-of-living areas earning relatively higher wages were being compared to a lower-cost-of-living threshold that was much too low compared to the cost workers actually face.
For example, the local living wage threshold for the metropolitan area of New York City is 23% higher than the national average at USD 30.79. On the other hand, workers in low-cost areas of the country were being held to an unnecessarily high threshold, a higher living wage than actually locally necessary. This year, Revelio Labs and Just Capital decided to adopt a local approach and compare worker salaries to the living wage threshold in their metropolitan area - a more ‘just’ comparison for everyone.
Interestingly, the difference in methodology makes little difference in the aggregate share of workers making a living wage. Under the national threshold, 65.4% of workers make a living wage, as opposed to 63.7% in the local threshold. The slightly lower share under the local threshold reflects the fact that relatively more Russell 1000 workers live in high-cost areas of living. Comparing their wages to a local threshold makes it harder to meet the cost of living standard.
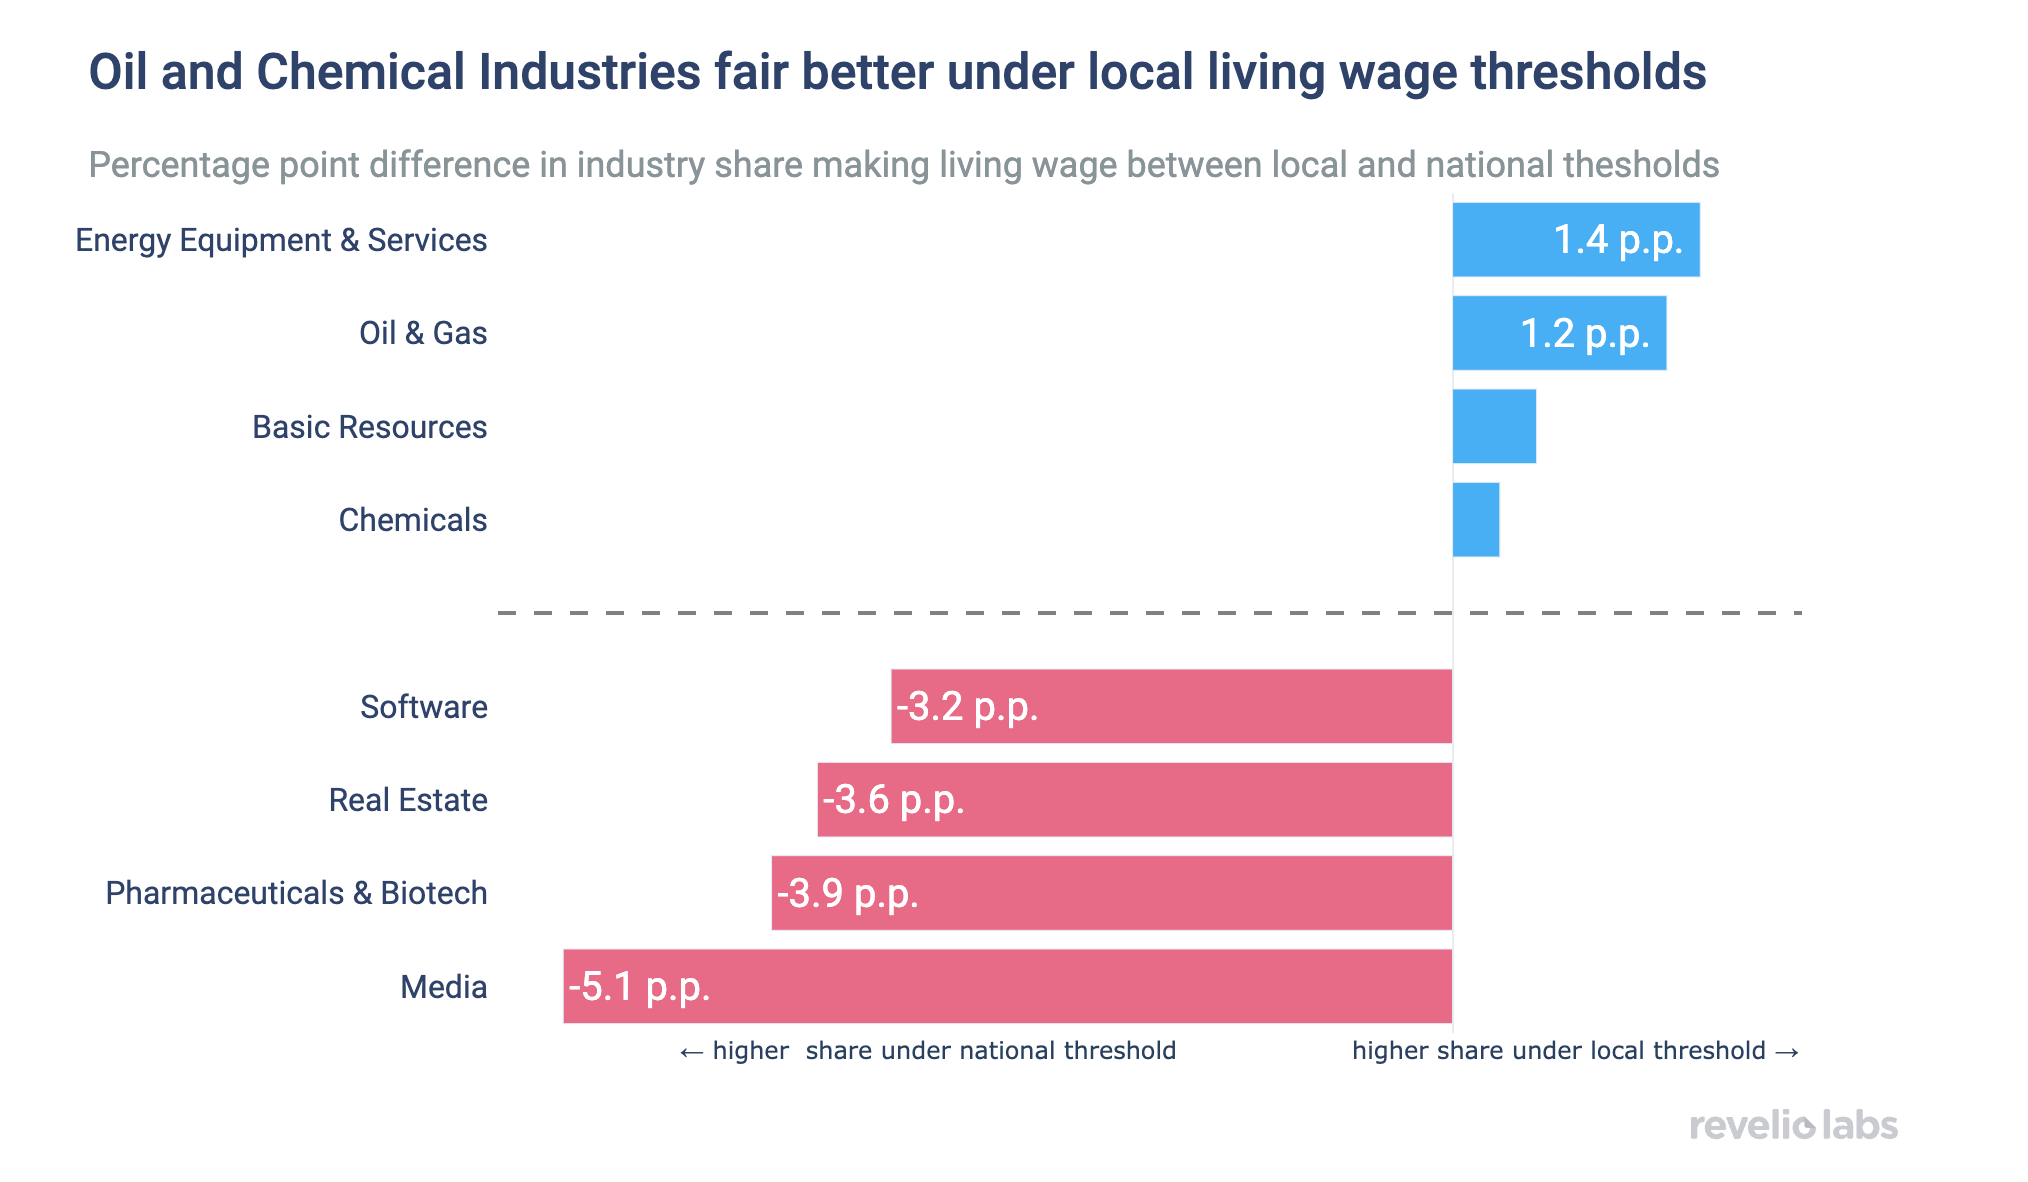
This is not true across all industries. Some industries fare better under the local threshold, while most industries do slightly worse under the local threshold. The industries that get higher shares of workers making a living wage are those with high concentrations of workers living in low-cost-of-living areas. Energy, Big Oil, and Chemical industries are the ones that experience the greatest positive shift in the share of workers making a living. Media companies, on the other hand, with high representation of workers in high-cost metropolitan areas, are doing much worse in the local threshold, as they are now compared to a much higher local standard.